Understanding Currency pairs is essential for anyone entering the forex trading market, as they represent the value of one currency compared to another. Traders use currency pairs to speculate on exchange rate movements and profit from price fluctuations in global financial markets. Major pairs like EUR/USD and GBP/USD are among the most actively traded due to their high liquidity and market stability. Learning how currency pairs move can help traders make better decisions and improve their overall trading strategies. With proper market analysis and risk management, trading currency pairs can offer valuable opportunities for both beginners and professional traders.
What Are Currency Pairs?
Understanding currency pairs is fundamental for anyone looking to enter the world of forex trading. At its core, a currency pair represents the exchange rate between two currencies, allowing traders to speculate on the relative value of one currency against another. For example, when you see the EUR/USD pair, it indicates how many US dollars (USD) one euro (EUR) can buy. This simple concept forms the backbone of the forex market, where trillions of dollars are traded daily based on these pairs.
The forex market operates 24 hours a day, five days a week, and currency pairs are the primary instruments traders use to capitalize on fluctuations in exchange rates. Whether you’re a beginner or an experienced trader, grasping how these pairs function is essential. On Evest, you’ll find detailed resources to help you navigate this complex but rewarding market. The beauty of currency pairs lies in their simplicity, yet their behavior is influenced by a myriad of global economic factors, making them both accessible and deeply strategic.
Why do currency pairs matter:
- They determine the value of one currency relative to another.
- They are the foundation of forex trading strategies.
- They reflect economic conditions in real-time.
- They allow traders to profit from both rising and falling markets.
Key components of a currency pair:
- Base currency: The first currency in the pair, which you’re buying or selling.
- Quote currency: The second currency, used to express the value of the base currency.
- Exchange rate: The price at which the base currency can be exchanged for the quote currency.
For instance, in the EUR/USD pair, EUR is the base currency, and USD is the quote currency. If the rate is 1.10, it means one euro can be exchanged for 1.10 US dollars. This dynamic relationship is what traders analyze to make informed decisions.
How Currency Pairs Work in Forex Markets?
The mechanics of currency pairs in the forex market are straightforward yet powerful. When you trade a currency pair, you’re essentially entering into a contract to exchange one currency for another at a predetermined rate. The forex market is decentralized, meaning it operates over-the-counter (OTC) rather than through a centralized exchange. This setup allows for continuous trading, as different financial centers around the world open and close at various times.
Trading currency pairs involves two primary actions: going long (buying) or going short (selling). If you believe the base currency will strengthen against the quote currency, you’ll buy the pair. Conversely, if you anticipate the base currency will weaken, you’ll sell it. This duality is what makes forex trading unique,, and you can profit in both bullish and bearish markets.
How to read a currency pair quote:
- Bid price: The price at which you can sell the base currency.
- Ask price: The price at which you can buy the base currency.
- Spread: The difference between the bid and ask prices, representing the broker’s commission.
Factors influencing currency pair movements:
- Supply and demand: High demand for a currency increases its value.
- Economic indicators: Data like GDP, employment rates, and inflation reports.
- Geopolitical events: Political stability or instability in a country can impact its currency.
- Market sentiment: Traders’ perceptions of economic health and future trends.
For example, if the US Federal Reserve announces an interest rate hike, the USD might strengthen across all currency pairs where it is the quote currency, such as USD/JPY or USD/CHF. On the other hand, if the European Central Bank signals a dovish stance, the EUR might weaken in pairs like the EUR/USD pair.
Base Currency vs Quote Currency
The distinction between the base currency and the quote currency is critical for understanding how currency pairs function. The base currency is always listed first in the pair and is the currency you’re either buying or selling. The quote currency, listed second, is the currency used to quote the exchange rate. This structure provides clarity on how much of the quote currency is needed to purchase one unit of the base currency.
The distinction between the base currency and the quote currency is critical for understanding how currency pairs function. The base currency is always listed first in the pair and is the currency you’re either buying or selling. The quote currency, listed second, is the currency used to quote the exchange rate. This structure provides clarity on how much of the quote currency is needed to purchase one unit of the base currency.
| Topic | Base Currency | Quote Currency |
| Definition | The first currency in a forex pair. | The second currency in a forex pair. |
| Purpose | Represents the currency being bought or sold. | Represents the value needed to buy one unit of the base currency. |
| Example (AUD/USD) | AUD is the base currency. | USD is the quote currency. |
| Exchange Rate Meaning | One AUD equals 0.75 USD when the rate is 0.75. | Shows how much USD is required for 1 AUD. |
| Example (USD/JPY) | USD is the base currency. | JPY is the quote currency. |
| Exchange Rate Interpretation | One USD equals 110 JPY when the rate is 110. | Shows how much JPY is needed for 1 USD. |
| Importance in Trading | Helps determine whether traders are buying or selling the pair. | Helps measure the value and movement of the pair. |
| Trade Direction | Buying the pair means buying the base currency. | Selling the pair means selling the base currency against the quote currency. |
| Common Misconception | Traders may confuse the order of currencies. | Ignoring the quote currency may lead to incorrect market analysis. |
| Risk of Misunderstanding | Incorrect interpretation can cause wrong trading decisions. | Misjudging currency strength or weakness can increase losses. |
| Market Impact | Base currency strength affects pair movement. | Quote currency weakness or strength changes the exchange value. |
Types of Currency Pairs
The forex market categorizes currency pairs into three main types: major, minor, and exotic. Each type has its own characteristics, liquidity levels, and trading strategies. Knowing these distinctions can help traders choose the right pairs for their goals and risk tolerance.
- Major Currency Pairs: These are the most traded currency pairs in the world. They involve the currencies of the world’s most economically stable countries. Examples include the EUR/USD pair, USD/JPY, GBP/USD, and USD/CHF. They offer high liquidity, tight spreads, and lower transaction costs.
- Minor Currency Pairs: Also known as minor pairs, these involve one major currency and one non-major currency. Examples include EUR/GBP, AUD/CAD, and EUR/CHF. They have lower liquidity compared to major pairs, which can lead to wider spreads. They are often traded by those looking for diversification beyond the major pairs.
- Exotic Currency Pairs: These exotic pairs involve currencies from emerging or smaller economies. Examples include USD/TRY (US dollar/Turkish lira), USD/ZAR (US dollar/South African rand), and EUR/SEK (euro/Swedish krona). They are less liquid and more volatile, making them riskier but potentially more profitable. They often require specialized knowledge and strategies.
Each type of currency pair caters to different trading styles. For instance, major pairs are ideal for beginners due to their stability and predictability, while exotic pairs might appeal to experienced traders seeking higher returns despite the increased risk.
Major Currency Pairs
Major currency pairs dominate the forex market, accounting for the majority of daily trading volume. These pairs involve the currencies of the world’s largest economies, including the United States, Europe, Japan, and the United Kingdom. Their high liquidity and tight spreads make them a favorite among traders, from beginners to institutional investors.
Characteristics of major pairs:
- High liquidity: Ensures that trades can be executed quickly and efficiently.
- Tight spreads: Lower transaction costs due to high trading volume.
- Stability: Less volatile compared to other types of currency pairs.
- Global influence: Movements in these pairs often reflect broader economic trends.
Most traded major pairs:
- EUR/USD pair: The most traded currency pair in the world, often referred to as the transatlantic pair.
- USD/JPY: Reflects the economic strength of the US and Japan.
- GBP/USD: Known as cable, it’s heavily influenced by UK economic data.
- USD/CHF: The Swiss franc is known for its stability, making this pair popular during market uncertainty.
Why trade major pairs:
- They offer the most predictable price movements.
- They are less affected by sudden political or economic shocks in smaller economies.
- They provide ample opportunities for both short-term and long-term strategies.
For traders looking to minimize risk while maximizing opportunities, major pairs are an excellent starting point. Platforms like Evest provide in-depth analyses of these pairs, helping traders make informed decisions based on real-time data and expert insights.
Minor Currency Pairs
Minor currency pairs (also called cross currency pairs) present a middle ground between the stability of major pairs and the volatility of exotic pairs. They consist of one major currency paired with another non-major currency, such as EUR/GBP or AUD/CAD. These pairs are popular among traders who want to avoid the USD while still maintaining a degree of liquidity. Unlike major pairs, which are heavily influenced by global economic powerhouses, minor pairs can offer exposure to regional economic trends, making them attractive for traders with a focus on specific markets.
Key features of minor currency pairs:
- Moderate liquidity: Higher than exotic pairs but lower than major pairs, leading to slightly wider spreads.
- Regional economic exposure: Movements are often tied to the economic health of the countries involved, such as the UK in EUR/GBP or Canada in USD/CAD.
- Lower volatility: Generally more stable than exotic pairs, making them suitable for medium-term strategies.
- Diversification benefits: Allow traders to hedge against USD-dominated portfolios.
Examples of popular minor currency pairs:
- EUR/GBP: Reflects the economic relationship between the Eurozone and the UK, heavily influenced by Brexit developments and UK economic data.
- AUD/CAD: Known as the commodity pair, it is influenced by fluctuations in oil and other commodity prices, as both Australia and Canada are major commodity exporters.
- EUR/CHF: The Swiss franc’s stability makes this pair attractive for traders seeking a safe-haven currency during market turbulence.
- GBP/JPY: Combines the UK’s economic performance with Japan’s interest rate policies, offering a blend of stability and opportunity.
Advantages of trading minor pairs:
- Lower competition: Fewer traders focus on minor pairs, which can lead to unique trading opportunities.
- Regional insights: Provides exposure to economic trends that may not be captured by major pairs.
- Potential for higher returns: While less volatile than exotic pairs, they can still offer significant price movements during economic events.
- Hedging opportunities: Useful for traders looking to balance their portfolios against USD exposure.
However, traders should be cautious when dealing with minor pairs due to their lower liquidity. Wider spreads and less predictable price movements can increase transaction costs and risk. Conducting thorough research and using risk management strategies is essential when trading these pairs.
Exotic Currency Pairs
Exotic currency pairs represent the most speculative and volatile segment of the forex market. These pairs involve currencies from emerging economies or smaller, less liquid markets, such as USD/TRY (US dollar/Turkish lira) or USD/ZAR (US dollar/South African rand). While they offer the potential for high returns, they also come with significant risks, including wide spreads, low liquidity, and sudden price swings driven by political or economic instability.
Characteristics of exotic currency pairs:
- High volatility: Prices can fluctuate dramatically due to political events, economic crises, or changes in government policies.
- Low liquidity: Limited trading volume can result in wider spreads and higher transaction costs.
- Geopolitical risks: Currencies from countries with unstable political environments are particularly prone to sudden devaluations.
- Niche trading opportunities: Often tied to specific industries, such as commodity-based currencies like USD/CNH (US dollar/Chinese yuan) or USD/COP (US dollar/Colombian peso).
Examples of exotic currency pairs:
- USD/TRY (US dollar/Turkish lira): Highly sensitive to Turkey’s economic policies, inflation rates, and political stability.
- USD/ZAR (US dollar/South African rand): Influenced by South Africa’s gold and platinum exports, as well as its economic growth prospects.
- EUR/SEK (euro/Swedish krona): Reflects the economic health of Sweden, a country with a strong export-driven economy.
- USD/MXN (US dollar/Mexican peso): Affected by Mexico’s oil exports, US-Mexico trade relations, and interest rate differentials.
Risks and challenges of trading exotic pairs:
- Liquidity risks: Difficulty in executing large trades without significantly impacting the market price.
- Spread risks: Brokers may charge higher spreads due to the lower trading volume.
- Leverage risks: High leverage is often required to make meaningful profits, amplifying both gains and losses.
- Regulatory risks: Some exotic currencies may be subject to capital controls or restrictions, limiting trading flexibility.
Despite these challenges, exotic currency pairs can be profitable for traders who understand the underlying fundamentals and are willing to take on higher risk. They are particularly appealing to those who specialize in emerging markets or have a deep understanding of specific regional economies. However, it is crucial to approach these pairs with caution and a well-defined risk management strategy.
Most Popular Currency Pairs in Forex Trading
The forex market is dominated by a handful of currency pairs that account for the majority of trading volume. These pairs are favored for their liquidity, stability, and the economic significance of the countries involved. Understanding the most popular currency pairs can help traders identify opportunities and develop effective strategies. Below are some of the most widely traded pairs, along with insights into their behavior and influencing factors.
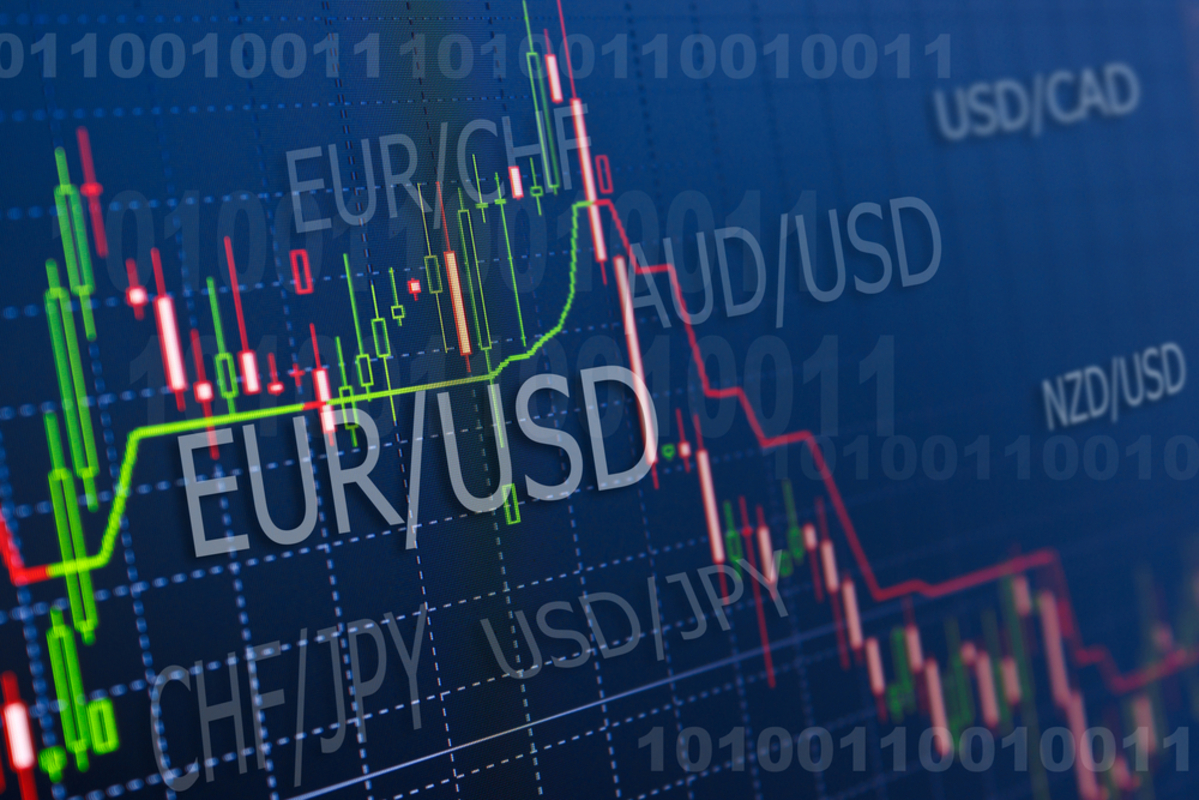
EUR/USD
The EUR/USD pair is the most traded currency pair in the world, often referred to as the transatlantic pair. It represents the exchange rate between the euro (EUR), the currency of the Eurozone, and the US dollar (USD), the world’s primary reserve currency. The EUR/USD pair is highly sensitive to economic indicators from both the US and the Eurozone, making it a barometer for global economic health.
Key influences on EUR/USD:
- US economic data: Non-farm payrolls, GDP growth, and inflation reports from the US significantly impact the pair.
- Eurozone economic indicators: Data on unemployment, industrial production, and consumer confidence in the Eurozone.
- Interest rate differentials: Decisions by the Federal Reserve and the European Central Bank (ECB) on interest rates.
- Political stability: Events such as elections, referendums, or geopolitical tensions in Europe or the US.
GBP/USD
The GBP/USD pair, also known as cable, is one of the most liquid and historically significant currency pairs in the forex market. The name cable originates from the telegraph cables used in the 19th century to transmit exchange rates between London and New York. This pair is heavily influenced by economic data from the UK and the US, as well as geopolitical events, particularly those related to Brexit.
Factors influencing GBP/USD:
- UK economic indicators: Data on GDP, retail sales, and manufacturing output from the UK.
- US economic reports: Similar to EUR/USD, US data such as jobs reports and inflation figures play a crucial role.
- Brexit developments: Negotiations, trade deals, and political outcomes related to Brexit continue to influence the pair significantly.
- Bank of England decisions: Interest rate changes and monetary policy announcements from the Bank of England can cause sharp movements in GBP/USD.
USD/JPY
USD/JPY is one of the most traded currency pairs in the forex market and is often considered a benchmark for measuring market risk sentiment. This pair reflects the relationship between the US dollar and the Japanese yen, with the yen commonly viewed as a safe-haven currency during periods of economic uncertainty. USD/JPY is highly sensitive to interest rate differences between the United States and Japan, as well as global financial market trends.
Factors influencing USD/JPY:
- US Federal Reserve decisions: Interest rate changes and monetary policy announcements strongly affect the pair.
- Bank of Japan policy: Japan’s low-interest-rate environment and stimulus measures influence yen strength.
- Global market sentiment: Investors often buy the yen during economic uncertainty or market volatility.
- US economic data: Employment reports, inflation figures, and GDP growth can drive major price movements.
USD/CHF
USD/CHF is a major forex pair that represents the exchange rate between the US dollar and the Swiss franc. The Swiss franc is widely regarded as a safe-haven currency due to Switzerland’s stable economy and strong financial system. As a result, USD/CHF often reacts to geopolitical tensions and shifts in global investor confidence.
Factors influencing USD/CHF:
- Swiss National Bank policies: Interest rate decisions and currency interventions can impact the pair significantly.
- US economic performance: Strong US economic reports usually support the US dollar against the franc.
- Safe-haven demand: During financial uncertainty, traders often move funds into the Swiss franc.
- Global geopolitical events: Political instability and economic crises can increase CHF demand.
AUD/USD
AUD/USD is a popular commodity-linked currency pair in the forex market, reflecting the exchange rate between the Australian dollar and the US dollar. The Australian dollar is closely tied to commodity exports such as gold and iron ore, making the pair highly responsive to global commodity prices and economic conditions in China, Australia’s largest trading partner.
Factors influencing AUD/USD:
- Commodity prices: Rising gold and metal prices often strengthen the Australian dollar.
- Australian economic data: Employment figures, inflation, and GDP growth affect the pair’s performance.
- Chinese economic activity: Strong demand from China can boost Australia’s export-driven economy.
- US Federal Reserve policy: Interest rate changes in the US influence the strength of the US dollar.
FAQs
What is the safest currency pair to trade?
Many traders consider major currency pairs like EUR/USD and USD/CHF among the safest to trade because they have high liquidity and relatively stable price movements. These pairs are supported by strong economies and usually feature lower spreads compared to exotic pairs. However, no currency pair is completely risk-free, so proper risk management remains essential.
How do spreads impact forex trading costs?
Spreads represent the difference between the buying and selling price of a currency pair, making them a direct trading cost. Wider spreads can reduce profits, especially for scalpers and short-term traders who open multiple positions daily. Choosing brokers with competitive spreads can help traders improve overall trading efficiency and profitability.
What strategies work best for trading currency pairs?
Popular forex trading strategies include trend trading, breakout trading, scalping, and swing trading, depending on market conditions and trader goals. Technical analysis tools such as moving averages, support and resistance levels, and RSI indicators are commonly used to identify trading opportunities. Successful traders also combine solid risk management with disciplined execution to achieve consistent results.